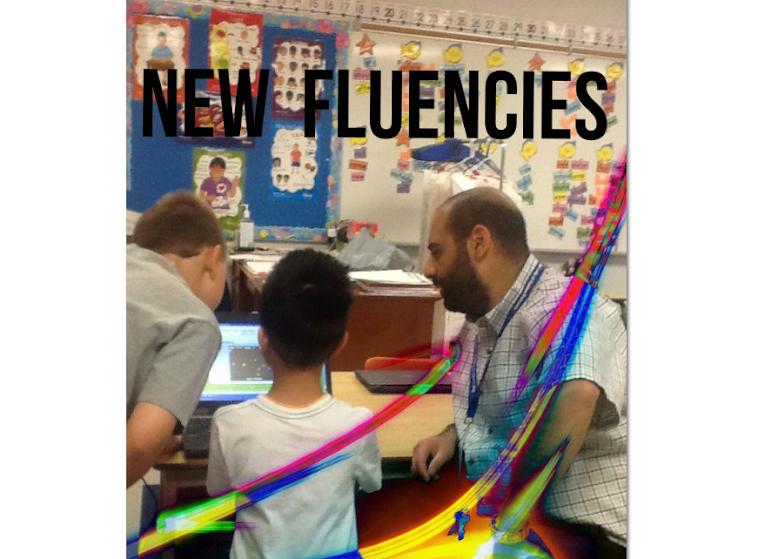
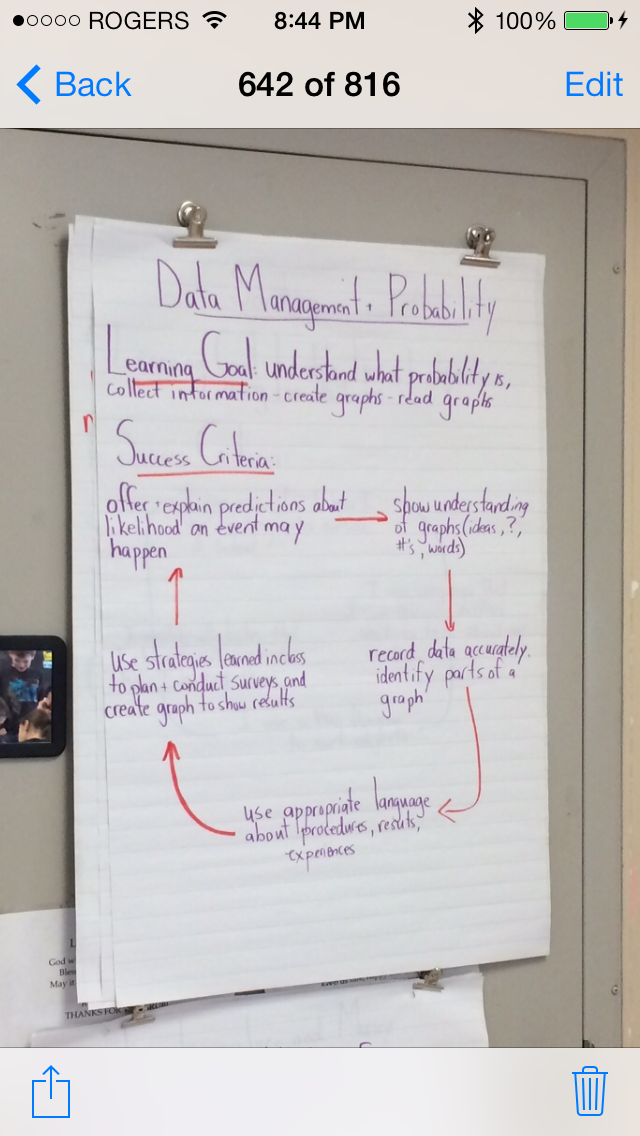
In our last unit of Mathematics (Data Management) the students learned how to conduct a survey, create a bar graph, and analyse a data set (collected data in a graph format). We created our learning goal and success criteria and made anchor charts for the students to refer to.
.JPG)
.JPG)
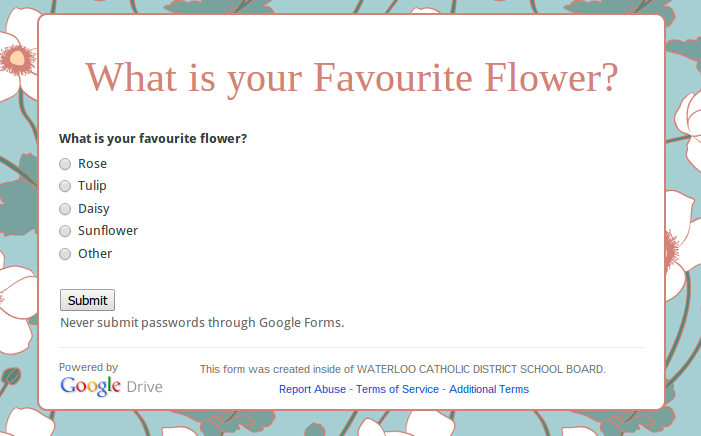
After learning some of the basics the students engaged in a paper-pencil activity in order to create their own survey. Once they had a good handle on the 'ins and outs' of what it means to create a survey and conduct one, they were taught how to use Google Form to create a digital/on-line survey. Via whole-group instruction we dove into Google Form and created a survey together. This provided the students with an opportunity to see how a survey is created in the Form application. The students were then given the opportunity to use Form to create their own surveys.
After learning some of the basics the students engaged in a paper-pencil activity in order to create their own survey. Once they had a good handle on the 'ins and outs' of what it means to create a survey and conduct one, they were taught how to use Google Form to create a digital/on-line survey. Via whole-group instruction we dove into Google Form and created a survey together. This provided the students with an opportunity to see how a survey is created in the Form application. The students were then given the opportunity to use Form to create their own surveys.


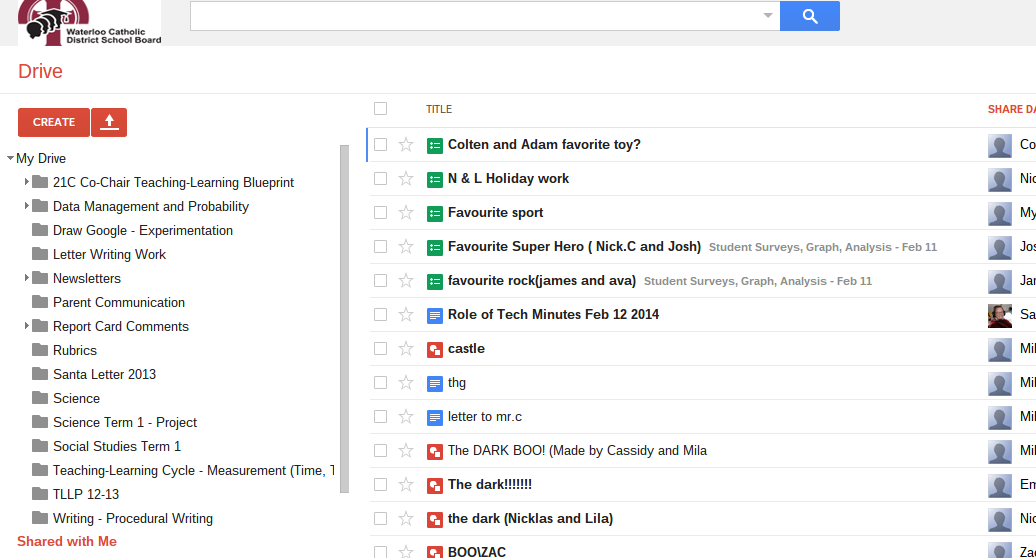
Here is a screenshot of my Google drive as students share their work with me. As the students are working on their Chromebooks I am logged in my drive and it is projected on the white board. I see their work in real time, help them troubleshoot, and use their work as examples/models for the class.
After the students created their survey, they posted the link to their survey in a Google Document that I had embedded into our LMS. Students had to copy their survey link and then log into the LMS in order to get to our shared Google Document so they could paste their site address in a table. When the table was completely filled in the students started to systematically do each survey and provided their classmates with "data". Here is a screenshot of the Google document - student names on the left and the link to their survey on the right:

By embedding the Google Document into our LMS and having the students place their information in one place we were able to save a lot of time and heartache by not having to type out long URL addresses for each of the 9 surveys they would complete.
.JPG)
.JPG)
.JPG)
Having collected a significant amount of data, the students then used Google Spreadsheet to create a bar graph. They entered their data into the spreadsheet and then used the data to create a bar graph.
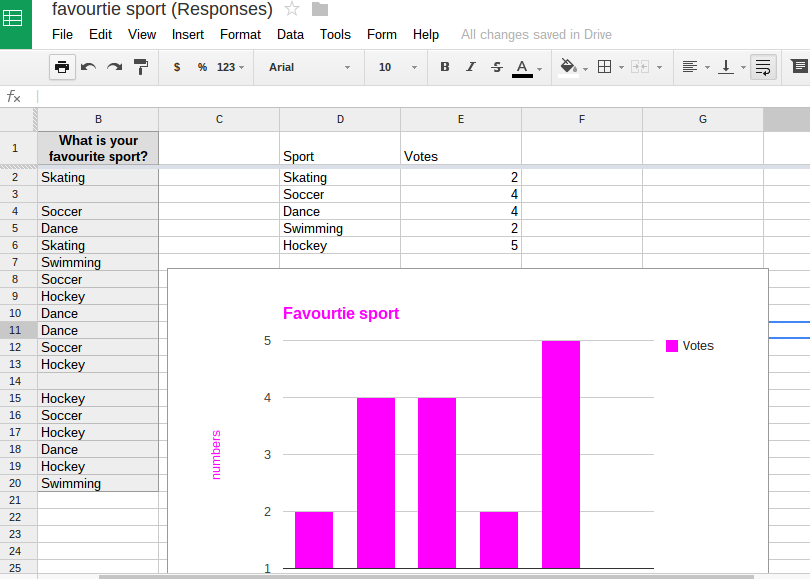

Google Spreadsheet provided the students with many challenges. There is a lot going on in this app and I would say that it is the most difficult to work with. The students who really understood what graphs are and how they are used did well with Spreadsheet. The students who experienced difficulty with the concept experienced some difficulty within the app. Nevertheless, the group ended up doing well overall.
Spreadsheet 'pushed' my students and that 'push' provided me with insight into how my students pace themselves and deal with cognitively challenging opportunities. It was neat to observe and I am pleased to report that no one gave up. Lots of questions were asked and a lot of troubleshooting occurred.
The students told me that they really liked the task at the end of this unit. There is no doubt in my mind that the enjoyment they experienced was linked to how much control they had in customizing their survey and graph. The students continue to demonstrate a high level of engagement and motivation when their learning is blended and they appear to have become quite skilled in the use of the Chromebook and the suite of Google Apps.
Rolland...this is phenomenal work. I am so sorry that I was not witness to this in person while at school with you. Thanks for all that you do to provide a 21st C teaching and learning environment for all.
ReplyDeleteThanks for you comment Tonya...and sorry for replying so late. For one reason or another, I was not made aware of your comment until now (March 8, 2014). Strange.
ReplyDelete