Wednesday, February 26, 2014

Teaching is the Key - Technology is the Tool - Success is the Outcome

Our project, "Success for all Students: 21st Century Teaching/Learning using Chromebooks & A Blended Learning Model", is adding a richness to our learning. This experience is proving to be a transformative one and there is no doubt in my mind that the technology is fostering innovation and creativity, among other things.

Nevertheless, the technology is only one part of the equation. +Jaime Casap does a great job of illustrating the importance of technology but that on its own it is not the key ingredient to success for students:

“Technology is not the silver bullet. Great education is the silver bullet. Technology is there to support and enable great education...We have to continuously ask how we can use technology to innovate in learning, because if we don’t then all we’re doing is potentially taking bad elements of education and making them faster and more efficient.”

When I talk to people about our project they often tell me that they would love to have this type of technology in the hands of their students. When I start talking to them about what I am doing with the technology their enthusiasm seems to deflate. They tell me that it sounds like more work is being added to an already full plate. I don't perceive it the same way they do and it is probably because I am truly passionate about the work we are doing and the positive results that are coming from it now and in the future.

In combination with the technology (allowing for the creation and completion of new tasks previously inconceivable), good teaching (incorporating such things as learning goals, success criteria, anchor charts, and manipulatives) and rich tasks provide students with opportunities to acquire and practice 21st Century skills (collaboration, critical thinking, communication, creativity) that are essential to success at school and in an ever changing world.

The following photos are good examples of what is happening in our classroom around the teaching and technology that is transforming professional practice and student learning.

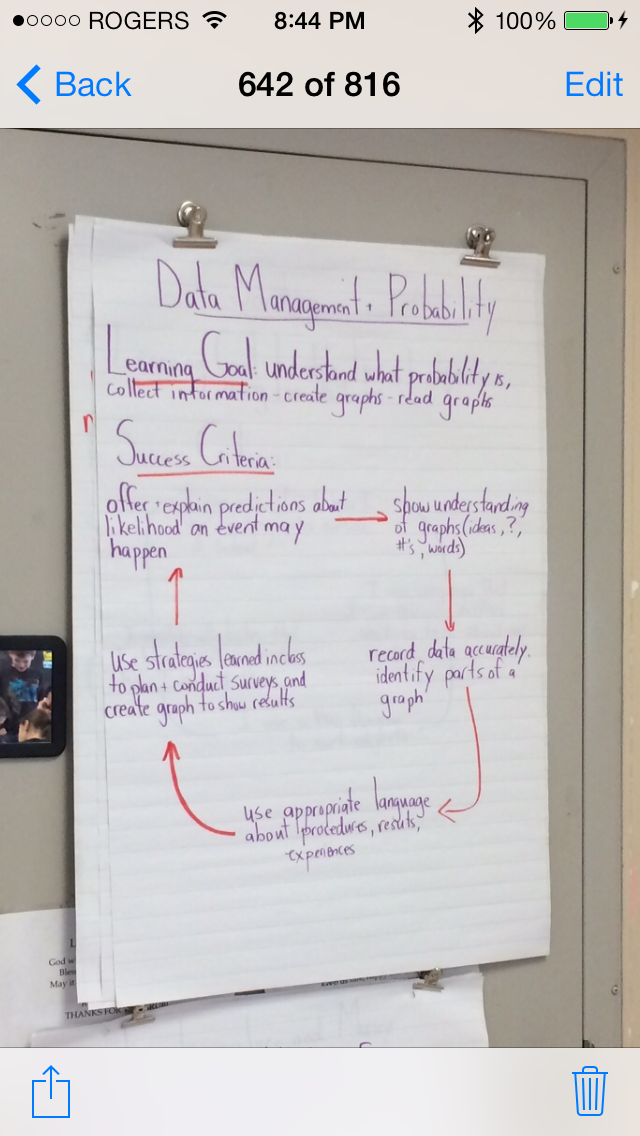
Learning goals and success criteria are created so students know exactly what they are working towards and what they need to do to be successful. These charts are important and have become common place in our classroom. 
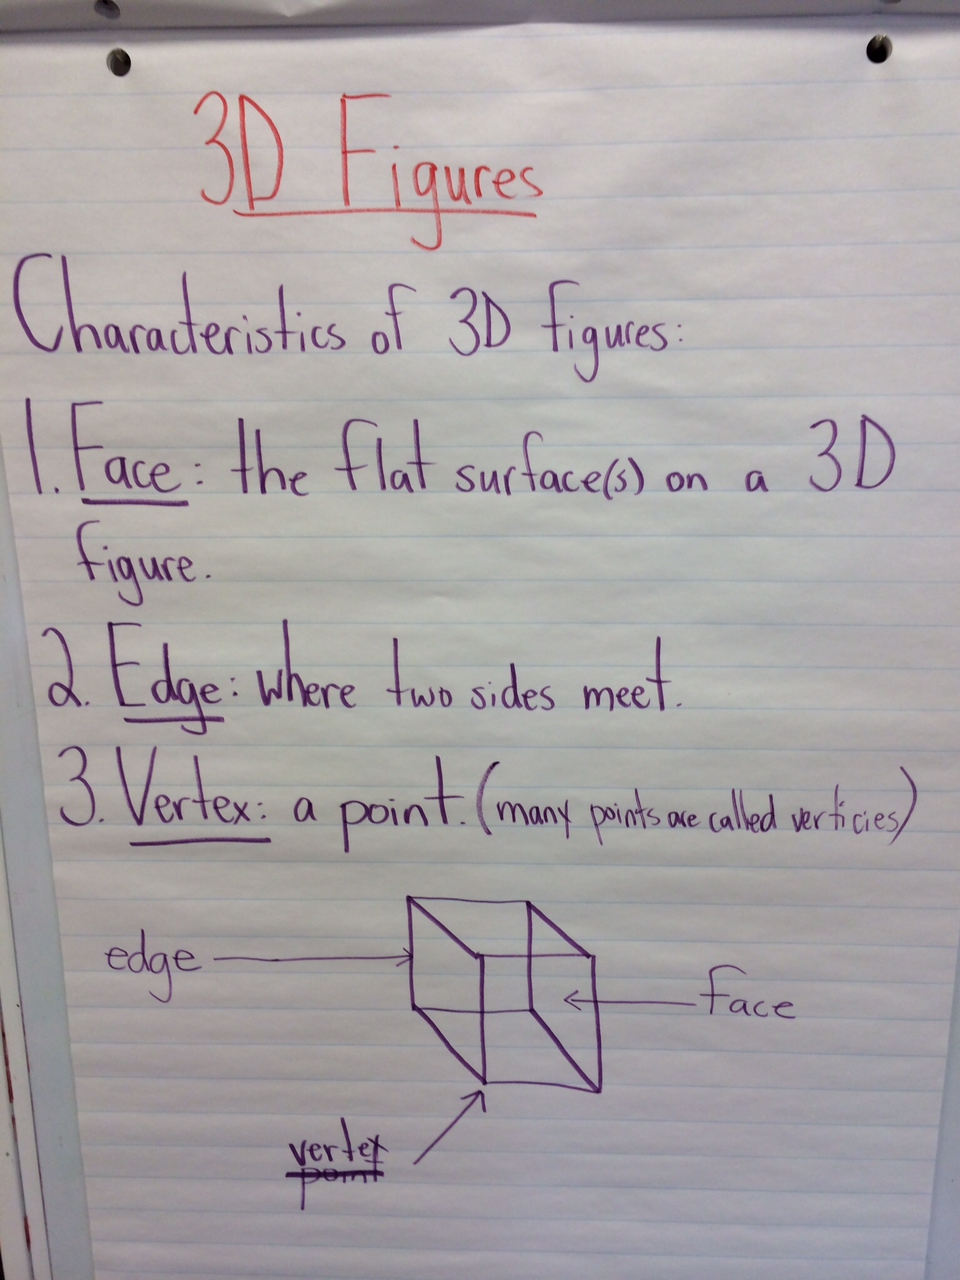
Anchor charts are used as a point of reference for students providing them with key information, processes, procedures, and/or strategies. 


Work area where students are using a variety of tools (manipulatives, paper & pencil, and Chromebooks) to support their learning in Mathematics.

A student using Google Draw to 1) illustrate the structure she created (a tall structure), 2) a photograph of a tall structure, 3) and some text explaining what she has done.   
The students working collaboratively using all of the tools to complete their assigned task.
If you have any questions or comments I would love to hear from you. Please feel free to contact me me via email, Twitter, Google +, or by leaving a comment for me here.

Saturday, February 22, 2014

The Work After The Work: GAFE Outside of Instructional Time

My students have been using Google Apps for Education on their own time to create, communicate, collaborate, teach, and continue the work they start in class. I recently overheard them talking about sharing their work with each other to simply share what they are up to and in some circumstances, to collaborate. Simply fantastic.

Student reflects on the Lego movie she recently saw by using the Draw app to draw some characters.

A student works on a "Diamonds" project because that is what he is interested in.

Two students write me a note during indoor recess.


Google Draw app used to write/draw about good times with friends.


Letter written to me from a student who is at home sick. She is also working on an assignment that was started in class.

Parent wrote me note to let me know that her daughter helped her create a Google Document for her work.

My students tell me that they like using GAFE because they can 

"write without using paper, it's free (open with lots of possibilities [images, research, colours, shapes, etc] - you can do different things with it, you can use your imagination with it and you just don't have to write, you can do what you want". 

They have moved past using GAFE exclusively at school. They seem to really like using the apps and are constantly digging deeper within the apps to make the most out of their experience! With this type of interest and motivation the sky is the limit and I am quite excited to see how high my students will go. 

If you have any questions or comments I would love to hear from you. Please feel free to contact me me via email, Twitter, Google +, or by leaving a comment for me here.

Thursday, February 20, 2014

Creating Surveys & Bar Graphs in Mathematics using Google Forms and Spreadsheets

In our last unit of Mathematics (Data Management) the students learned how to conduct a survey, create a bar graph, and analyse a data set (collected data in a graph format). We created our learning goal and success criteria and made anchor charts for the students to refer to.


After learning some of the basics the students engaged in a paper-pencil activity in order to create their own survey. Once they had a good handle on the 'ins and outs' of what it means to create a survey and conduct one, they were taught how to use Google Form to create a digital/on-line survey. Via whole-group instruction we dove into Google Form and created a survey together. This provided the students with an opportunity to see how a survey is created in the Form application. The students were then given the opportunity to use Form to create their own surveys.


Here is a screenshot of my Google drive as students share their work with me. As the students are working on their Chromebooks I am logged in my drive and it is projected on the white board. I see their work in real time, help them troubleshoot, and use their work as examples/models for the class.


After the students created their survey, they posted the link to their survey in a Google Document that I had embedded into our LMS. Students had to copy their survey link and then log into the LMS in order to get to our shared Google Document so they could paste their site address in a table. When the table was completely filled in the students started to systematically do each survey and provided their classmates with "data". Here is a screenshot of the Google document - student names on the left and the link to their survey on the right:


By embedding the Google Document into our LMS and having the students place their information in one place we were able to save a lot of time and heartache by not having to type out long URL addresses for each of the 9 surveys they would complete.


Having collected a significant amount of data, the students then used Google Spreadsheet to create a bar graph. They entered their data into the spreadsheet and then used the data to create a bar graph.


Google Spreadsheet provided the students with many challenges. There is a lot going on in this app and I would say that it is the most difficult to work with. The students who really understood what graphs are and how they are used did well with Spreadsheet. The students who experienced difficulty with the concept experienced some difficulty within the app. Nevertheless, the group ended up doing well overall. 

Spreadsheet 'pushed' my students and that 'push' provided me with insight into how my students pace themselves and deal with cognitively challenging opportunities. It was neat to observe and I am pleased to report that no one gave up. Lots of questions were asked and a lot of troubleshooting occurred.  

The students told me that they really liked the task at the end of this unit. There is no doubt in my mind that the enjoyment they experienced was linked to how much control they had in customizing their survey and graph. The students continue to demonstrate a high level of engagement and motivation when their learning is blended and they appear to have become quite skilled in the use of the Chromebook and the suite of Google Apps.

If you have any questions or comments I would love to hear from you. Please feel free to contact me me via email, Twitter, Google +, or by leaving a comment for me here.

Friday, February 14, 2014

Blended Learning and #GAFE Strike Again!

Today is Valentine's Day and I am engaging my students in Math "work" during the last block of the day. Anyone who spends their time in an elementary school can describe what this time of the day might stereotypically look/sound like....but the stereotype didn't fit with my students/classroom today. I wouldn't normally do Math at this time of the day but today was different. Mrs. +Tonya Reesor, VP at Blessed Mother Teresa Catholic Elementary School and a fellow co-chair of one of our Board's working groups to assist in developing our 21st Century Teaching and Learning Blueprint, was at St. Anne (K) and was invited to visit our classroom to see what my students were up to with respect to the Chromebooks and blended learning. This time was the best time of day for Tonya and I really wanted her to see the transformative learning going on in our classroom.

We started our 3D Geometry unit and it was business as usual as we created our learning goals and success criteria and our first anchor chart. This happened earlier in the day.
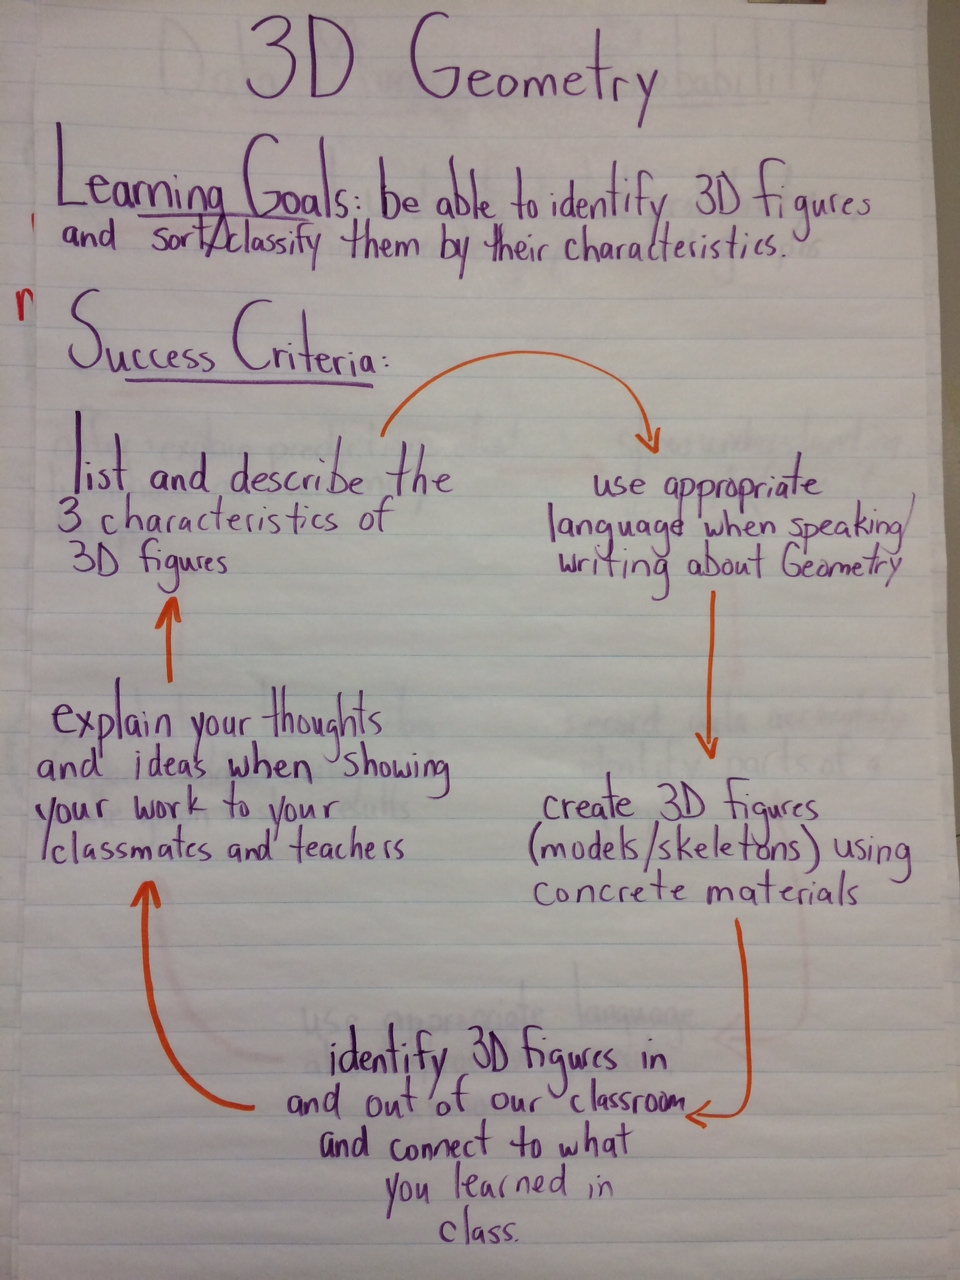

**

We started by reviewing the charts and and talking about the characteristics of 3D figures. The students then logged in to our LMS site in order to start working with an OERB learning activity called "3D Figures: Grade 2 Mathematics" which introduced them to a variety of 3D figures, provided a brief lesson on faces and edges, and allowed them to sort 3D figures by their geometric properties.


After completing the OERB activity the students were then directed to work in a Google Document (link to the document was provided in our LMS site) to use the characteristics of 3D figures to write riddles for their friends to try and answer.

Screenshot of the example provided to students in the Google document that they would be working in.

What happened next was a treat for me to watch and listen to. The students were totally engaged and having fun. They took the time to go through the digital activity and some of the pairs went through it 2-3 times. Students started grabbing 3D figures to hold on to and look at half way through the digital activity. When they jumped on to the Google document things went up a notch as students enjoyed working together and demonstrated a real focus on the task at hand.

Google document is a great communication and collaboration tool for the students and myself. In real time I could see what everyone was doing and get a feel for what was going on. I would purposely communicate with specific students as I watched them type their work into the document. At first they would look at me funny, wondering how I knew what they were thinking but they quickly got used to it and became fully aware that all of us could see each other's work. I made a point of using the document to see if it would assist me in being able to assess who required support and who required enrichment. I am pleased to report that it did assist me in providing appropriate feedback/support to students working at a variety of levels.

Here are screenshots of the progress students made in the document.

The coloured squares in the top right hand side are my student pairs logged in to the document - they are all in and ready to create their riddles.

The students starting their work.

Progress is being made. Right hand side shows a comment that I made to a pair.
Second page of the document as it grows because of student input. A student responds to one of my comments.

Some of my comments to the students.

While the students were working in their pairs, I was centrally located in the room with my Chromebook - monitoring their progress, making comments on the document as well as speaking to them as they worked in their space. I also had the document projected on our whiteboard in order for students to see what was happening when they weren't in front of their Chromebook. Along with the OERB activity and the Google document I had a box of 3D figures (which I referred to above) that students could actually hold in their hands. The combination of all of these things made for a rich learning environment. Students were working at their own pace and at their particular level of understanding. I was there for them to seek out, I sought them out, there was the anchor chart for them to refer to, they could talk to their friends about their issues/concerns/questions, and they had the document to look over if they didn't want to engage another person.

Did I mention that the students were doing all of this during the last block of the day on a Friday and that is was also Valentine's day? If you had been in the room you would never have guessed that it was the end of the day before a long weekend. The students were engaged, having fun, and applying some of the knowledge they had just been exposed to. It was a great start to the unit and I look forward to blending their learning as they continue to learn about 3D Geometry. Sadly, +Tonya Reesor didn't end up visiting because an issue fell into her lap (did I mention that it was the last block on Friday?) minutes before she was to join us. The students were sad that she wouldn't be joining us but were able to put that behind them and get to work.

If you have any thoughts/questions/ideas that you would like to share please feel free to connect with me via email, Twitter, Google +, or leaving a comment for me here.

Saturday, February 1, 2014

Blended Learning and GAFE in Social Studies

My students are just wrapping up a blended learning unit on Traditions and Celebrations in Social Studies. The application portion of the unit, which was also the culminating task, was to invent their own celebration that included the characteristics of celebrations (name, food, decorations, and traditions) that we talked about during the unit.

Here is the learning goal and the success criteria for the unit:

Learning Goal and Success Criteria for our Social Studies work.
In this unit the students used two OERB interactive lesson/activities and learned how to use Google Presentation in order to work on their created celebration.

The unit started with a diagnostic activity in order to find out what they know about traditions and celebrations. They used a graphic organizer to write/draw what they know about about the topic. Their work was assessed by looking over their graphic organizer to determine whether their knowledge was accurate or not. Generally speaking, the students were not accurate in their understanding of what traditions and celebrations are.

We then formally defined what traditions and celebrations are. The students then made a connection to a common tradition/celebration that is common to their family. The students were were given the opportunity to make their connection by talking about it, writing about it, drawing it, and/or acting it out. The students were assessed by conferencing with them and determining whether the tradition and celebration meets matches with the formal definition that was introduced to them.

Anchor chart that defines traditions and celebrations.
At this point we discussed the common features of celebrations (e.g. birthday parties) like food, decorations, and specific things that are done at celebrations (traditions). Students were informed that they should pay close attention to these common features because they would come up again in the application portion of this unit. Students were assigned a task to do at home with their parents - to talk about and record information about their favourite family celebration and the food, decorations, and traditions that are part of this particular celebration. This activity would also provide them with a preview of what they will be doing on their own at the end of the unit.
Birthday celebration anchor chart.
The students were expected to orally present their homework to their classmates. This would provide them with great practice for the oral presentation of their invented celebration at the end of the unit.

Oral presentation anchor chart.
The students homework was looked over to ensure that all sections of the organizer were complete and they were given feedback on what they did well and what they need to work on with respect to their oral presentation.

Having explored traditions and celebrations within their household, we shifted gears and started looking at the traditions/celebrations of culturally diverse groups. Students logged into our LMS page and engaged in an OERB lesson activity called "Traditions and Celebrations" (ELO1301470). In this activity the students learned about Diwali and Chinese New Year. 

"Traditions & Celebrations" interactive lesson/activity.
The students used a Venn diagram to compare similarities and differences of the two celebrations/traditions.

Anchor chart created to remind students to use proper terminology - Venn Diagram was completed after the students completed the interactive OERB work.

As the students were working on the Venn diagram activity I informally assessed their work/understanding by moving around the room and asking question about the similarities and differences between the Chinese and Hindu celebrations. I also examined their Venn Diagrams to ensure that they were on the right track.

After that activity the students engaged with another OERB lesson/activity. They explored some of the holidays celebrated in Canada by Canadians of various cultural and ethnic backgrounds. "Celebrations in Canada" (ELO1415420) allowed the students to explore Kwanzaa, Chinese New Year, and Canada Day in an in-depth fashion.


When the students completed the learning activity they made a text to self/text to world connection (e.g. what did the celebrations in the learning activity remind you of?). I briefly conferenced with each student to get an idea of the connection they were able to make to the new learning. The graphic organizers they used to record their connections were reviewed shortly after the students completed their work.

At this point the students were ready to engage in the final task of the unit - invent their own celebration. We reviewed the anchor charts created during this unit and the students were told that they would get to create their own celebration based on the characteristics of celebrations that they learned about throughout the unit. The students were also informed that they would be presenting their work. We reviewed what was explicitly taught about what they need to do in order to provide an effective oral presentation.

Once the students completed their work using paper and pencil they were introduced to Google Presentation as I modelled how to use the application by creating my own invented celebration. The students were reminded of the criteria and were encouraged to use their draft (paper copy of their invented celebration) to guide them in creating their digital slide. Here is the presentation they created:


Please do check it out and let us know what you think!

If you have any questions/comments, please feel free to reach me here by leaving a comment, via email at rtwcdsb@gmail.com, on Twitter @rchids, and/or on Google+.